
Reality and Fiction merge in The Phoenix Agenda Trilogy -- Economists tell stories for a living, conjectures and assumptions about the future based on statistics, models, and a good part -- what happened in the past will come again. But in truth, forecasts and fiction are close cousins. For most of my career, I have combined conjecture, models, data, along with writing fiction. Its more fun to write fiction than economic papers and articles that few will read. The Phoenix Agenda Trilogy is part conjecture, part possibility, and part hope as to where modern, managerially directed, self interested, capitalism might evolve to with just a little push....
The Phoenix Agenda Trilogy is a story in three parts. Like all good stories it begins with an idea – what if you could play the market in a way to use the greed of the players against them destroying Wall Street and gaining control, at least on paper, of the richest and most successful international companies for pennies on the dollar, thus Book 1: The Ancient and Honorable Society of the Phoenix, begins the tale. Like all good ideas, it leads to many unintended consequences for the players and for the played, and of course all of us ordinary people who must live with the effects, this is the second act, Book 2, The Phoenix Storm. Before the hero and heroine can find a way forward, they must surmount obstacles, the reluctant plotters now facing the reality of what they started, a Russian Civil war, rescuing a man from a Russian prison, disarming a nuclear bomb in countdown before it destroys St. Petersburg, and reaching a mountain top Swiss hotel in time to regain control of ownership of the world’s great companies in order to finish the plan and save the world economy from the next Great Depression. And in the third act, like in all good stories, the heroes of the play find a way to turn the bad into good, and we all live happily ever after with the result, Book 3, Recovery and Rebirth. Or do we, for there is also a post-script for every good idea has a problem, but this will be left to some future story yet to be written.
The author began the writing of the story fifty years ago during the first of the modern day global financial crises – the advent of the OPEC Cartel and their sudden quadrupling of the price of crude oil creating a massive problem for rich and poor nations alike, working in Geneva, Switzerland for the United Nations, living what is best described as “the good life by the lake”, he wanted to do more, tell stories that interested, do research into the world economy that could change the lot of the poor countries without damaging the rich ones, an idealist in an organization that seemed more dedicated to hosting the next meeting that would do nothing but could maintain the status quo. In a sense he was just too ambitious to make changes in the world system to stay there despite the advantages of good pay, long vacations, little real interest in anything he might suggest to make the world function better. Writing about a fictional cabal of wealthy men to force changes in the current system of capitalism was far more interesting than building another economic model or writing a paper that no one would read. Fiction is a good avenue for sharing your views without preaching, and people are more interesting to write about than theoretical equations.
The initial story was inspired by the success of another economist turned novelist – Paul Erdman (The Billions Dollar Sure Things, The Silver Bears, etc.). On his honeymoon to Europe, a mix of business and pleasure, he was introduced to an American economist living then in England after having escaped from a Swiss prison for letting his Swiss-based bank go bankrupt over an effort to corner the world cocoa market, Paul Erdman. He had just sold his first book to a major publisher, The Billion Dollar Sure Thing, and would later go on to sell a string of novels, one at least turned into a major movie, which bombed economics and financial manipulation with good, fast paced story telling.
A year later, a dream job for a newly minted Ph. D economist was attained. I could pursue my ideas for how to improve things for poor countries, living in a beautiful environment, getting good pay, living what people who have worked in Geneva, Switzerland for the UN call, “the good life by the lake”. UNCTAD in the mid-1970’s was a place of contrasts. The Western trained economists working there were either Socialists or Realists. The Socialists were even more radical than the staff from the developing countries who were just happy to be working in Geneva and not in Bangkok and who knew that none of these more radical ideas from reforming global companies through a Code of Conduct for Multinationals or forced restructuring of world industry were, pipe dreams, unlikely to happen, but useful for maintaining the fiction that the world could be made better for all people through united actions. In 1977 the OPEC Cartel suddenly raised the price of crude oil by a factor of four times and created the first great global financial crisis. Poor countries started to borrow from Western banks to pay for the higher priced oil, while oil producing states placed their ill-gotten gains with these same banks. When the world economy sputtered, then the threat of mass default sent the global economy into a tailspin. It was during this period of great uncertainty, that the first Book of what will later be the Trilogy, began to take shape.
Book 1 of the trilogy started here, writing on an electric typewriter, sitting on the balcony of my apartment, with a beautiful view of the Jura Mountains, while underneath they were tunneling out the space where for CERN’s Large Hadron Collider, a linear accelerator designed to seek to understand the fundamental laws of the Universe. The first version of this story, The Ancient and Honorable Society of the Phoenix, started with an idea – what if you could artificially raise the price of gold to new highs once you had accumulated a massive stock of the precious metal at earlier lower prices, then through a series of sequenced negative events drive down global share prices to depression era lows, sell the gold leaving the market insiders holding gold while selling off shares only to see a new group of investors buy up controlling interests in global multinationals for pennies on a share, while they are left with gold now selling again at its true market price, then altruistic billionaires could change capitalism to something more useful for today’s interconnected world. Unlike the greedy men in Erdman’s stories, interested in their own financial wellbeing at the expense of the world’s rich or poor, could use that power to change capitalism from personal self-interest of shareholders to help all stakeholders – workers, communities, and the global common. The plot of the first version of this story has been lost, the technology of typing and retyping the story, too inefficient, and despite on my return to the States it had found even a reputable agent from William Morris, no success in selling it to the public. After this failure, I turned my attentions to the problems of insuring that the United States did not give away or lose the ability to maintain a viable defense production base. My next job was as Senior economist advising the Secretary of Defense on issues ranging from cooperation between NATO countries to the impact of the Department on the US and world economies.
As I was building my professional career, developing large scale models and databases of the world economy for private and public sector users, trying to understand how industries integrate with one another, or why one economy prospers and others fail, I was also feeling the ups and downs of the market creating a kind of depression that comes from not being able to solve the problems of climate, energy, and wealth inequality without a major change in thinking about how markets work. In Adam Smith’s world, capitalism’s secret sauce is greed and self-interest, but it no longer worked well in a globalized and fully integrated world economy. In the future capitalism will only thrive when everyone is fully engaged, when workers are all paid a living wage, when government make it easier to work so long as companies follow clear rules with respect to the environment and worker safety allowing for no “free riders” passing on the costs to others while maximizing profits for themselves.
With the ability to save drafts of the story electronically, I would periodically revise the story, adding new characters and events, shifting the point when the market collapsed forward a few years. Writing this was a kind of therapy for the inability that one feels like events are cascading beyond anyone’s ability to stop the bad things from happening to the world. I didn’t try to sell the story, but rather enjoyed the challenge of shifting the timeline, but in 2012 an English publisher contacted my older daughter about a travel book she might have to be published. She said she didn’t, but her father had this novel, unpublished, maybe she might like to see it. The first volume of the story was then published a couple of years later as The Phoenix Year (Wattle Publishing, 2014). As a result, I was obligated to write the remaining two books of the trilogy. Only the first novel was published to reasonable but few reviews (none by any major reviewer), little advertising, and I guess limited sales. The publisher was unable to supply any details and I asked for all the rights back and earned a lump sum pay-off of $ 150. The remaining two books of the story of how capitalism as we know it might well be changed into something less organized around individual self-interest of managers and into something more cooperative meeting the needs of shareholders, workers, and communities, were finished allowing the author the satisfaction of an ending of the sage, and then the impossible happened – Donald Trump won the Presidency and the worldwide pandemic upset the economic apple cart in aways that were impossible to predict.
Why Trump’s victory and the forced shutdown of the US and world economy with all its negative effects on supply chains was a perfect opportunity to revise the story in a major way. It was not that Donald Trump had not figured in the earliest drafts of the novel, he was there in the persona of Ben Masters, the New York real estate developer who put his name on all his buildings, and whose portfolio of prime properties were a set-up for a massive default, Trump had been a major part of the story once it was rewritten in the early 1980’s. That was the “standard” Donald Trump that the author knew from his years living and working in New York, the ever-bankrupt promoter with a massive ego and his name on all his properties, but this new Trump, Trump the incompetent President was something new, interesting, even frightening, and he was having a dire impact on the economy and the country that needed to be analyzed. In the 2014 published novel, The Phoenix Year, the economist working for the President, then a Democrat, had tried to stop China from taking over all of world manufacturing causing the first part of the story, the collapse of energy and raw material prices. The problem structurally was now we had Trump in office, and we moved the story to 2020 rather than 2016, could this same man choose to work for someone like Trump? How could he become the economic advisor of a poser like Trump, now called President King, and still retain the authors trust in his judgement for the following two novels. The answer was to let the former Democratic President convince him to take the job offered by King for the good of the country and to try to stop the President’s worse policy choices from sinking the America and world economies. This allowed the story to cover the current questions of the pre- and post-pandemic economy. Today’s financial meltdown is limited compared to the disaster that happens at the end of Book 1.
The trilogy is being offered in a single massive volume as well as in the three smaller bites because perhaps someday someone will see it for what it really is – a discussion of the economic ups and downs of the past two decades starting with the financial panic of 2007-09 and ending with the massive efforts to get the US and world economy started after the pandemic shutdowns and the failures of the Congress and the Trump administration to do enough to rebuild the small and medium companies – the shops and restaurants – that are the heart and soul of Main Street America and were damaged severely by the pandemic. The three books, taken together show in fictional form, written in the vernacular of a political-economic thriller, is a vision of how modern-day managerial capitalism based on the original economic paradigm that Adam Smith laid out in the 18th century of self-interest and greed as the organizational principles of markets, might be changed into something better suited to deal with the problems of climate change and massive social and wealth inequality we now face in the 21st century.
David Blond, International Economist, MA, Ph.D.
Resume: MA, Ph.D. NYU 1969-1973, Business International, New York, 1973-74; UNCTAD, Geneva, Switzerland, 1974-78; Office of the Secretary of Defense, Washington, D.C., 1978-85; Data Resources, Inc., Washington, D.C., 1985-1995; ICF-Kaiser, Fairfax, Virginia, 1995-96; The Columbus Group, Fairfax, Virginia, 1996-1997; Merge Global, Arlington, Virginia, 1997-2003; QuERI-International, Washington, Santa Fe, Denver, 2003 – Present (www.queriinternational.com).
.
|
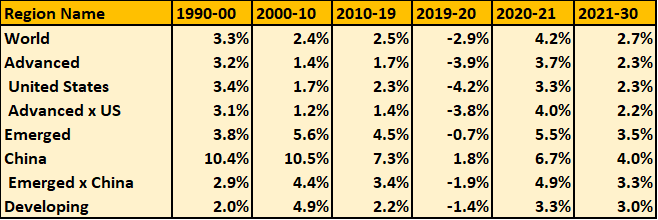
The impact on the global economy needs to be in context of the previous expectation of growth -- a negative three percent real GDP growth for 2019-20 for the world is almost a six percent shift from the pre-Covid 2020 forecast. The damage of the pandemic could have been worse and would have been if the governments, mainly in the advanced countries, had not stepped in and created a massive flood of replacement funding for small businesses and individuals.
Our assumption about a recovery is based on a belief that the virus will be kept under control either through government actions, the vaccine, or simply the governments allowing letting business restart without control. The economic shock to the service sector is allowed to continue significantly reduced in 2021, but for the most part beyond the initial shocks to the system introduced in 2020, the long term forecast reflects internal linkages in the model. |
Why the QuERI Integrated Global Model is a better model measuring the impact of the Covid19 selective shutdowns than more traditional, even linked, global macro models?
1. QuERI model's are sector specific, thus the degree of shutdown is sector specific and country specific with the effect felt through the interindustry linkages. 2. Patterns of industrial, trade, and employment are key drivers rather than broad based macroeconomic single equation model. 3. A Stage of Economic Development economic model allows poor countries to migrate both their rate of growth and their demand patterns to countries further up the development ladder. |
A short summary of the latest QuERI Integrated Global Model World Forecast of Real GDP Growth -- 1990 through 2030 |
|
|
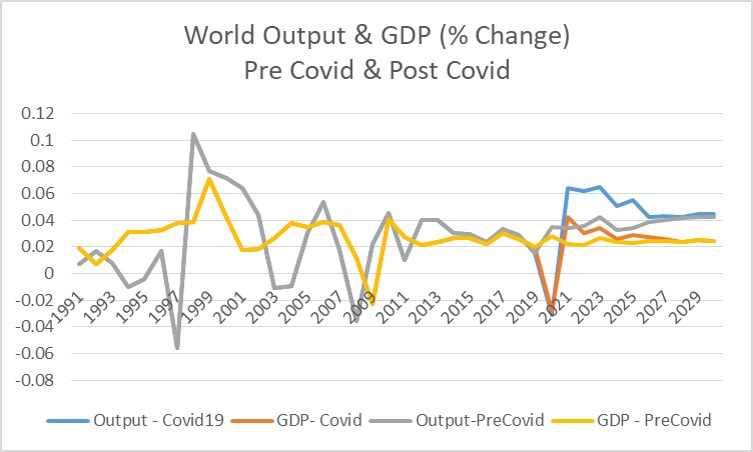
Gross Output Growth and GDP Growth rates differ for many reasons, not the least may be the fact that one reflects the productive activity of companies and individuals across products with different wage and profit shares. GDP growth is less volatile. We expect that the gross output for the world will recover rapidly returning following the pattern set by the 1997-99 recession, the 2007-2010 recession before trending back in line with the pre-Covid growth rate for both GDP and Gross Output.
|
| impact_of_covid19_on_the_world_economy__1_.pdf |