

|
Data is only useful if it can inform decision making. Over the years I've developed a number of techniques for integrating QuERI datasets into company data and decision making.
QuERI data is detailed with respect to industries and to sources of demand. It is based on available historical data but cleaned and converted to make it consistent across countries of different sizes and degrees of development. The pooled cross sectional methodology is ideal for developing relationships between industry groups, countries, or for linking company sales data for products with economic data on market size and growth. These are some examples for different industries or use cases of how this data can be used for informing corporate and government decision making. |

Using QuERI Data for Financial Analysis
QuERI data can be used to help analysts understand the dynamics of markets and how these impact individual companies and sectors. Some of the possible uses in the financial sector include the following:
Rebalancing multi-asset and multi-country portfolios QuERI data is multi-country and multi-industry. It’s available as broad industry aggregates down to commodity detail by NAICS 6 groups. Covering 72 countries and six major regions plus world, it’s ideal for developing ETF indices or share portfolio’s that are globally balanced by industry, regions, or globally. As the tables show shares will change over time. Thus QuERI baselines can be used for a forward looking at which industries and sectors will be increasing their share of the global economy and which will be losing share. QuERI data is fully consistent in definitions across industries and in value measures (current and real US 1995 dollar prices and exchange rates). Updated using the latest available international trade, industry and macroeconomic data with new baseline estimates for forecasts developed quarterly, QuERI industry and trade data is the most complete source for developing unique, industry and country specific, portfolios of international shares and indices.
|

Integrated Planning Resource Systems
The development of the cloud as a single repository for company proprietary data offers a potential to for companies developing products for use with the major cloud systems – Amazon, IBM, Microsoft, and Google, to name a few major players – to standardize the way data is arranged and to develop in conjunction with company owned, licensed or adjusted economic data econometric models to link company sales data to industry demand and trade with the finished product laid out in standardized or proprietary front-end software. By developing the necessary tools and packages for deployment of existing company sales and market data combined with licensed output of sufficient detail to make these forecasts useful for decision making, turn-key projects can be offered to clients by combining sufficiently detailed global economic forecasts with existing tools embodied in Cloud systems.
Objective Integrated planning systems are dynamic forecasting tools developed to gather, analyze and continuously update corporate short, medium and long-term sales data by markets and product-lines. Systems are designed to provide senior staff with analyses of market potential based on a marriage of internal sales information with external economic data drawn from industry specific databases.[1] A fully functioning IPS links business unit sales with external market data on a regular schedule. Planning becomes a continuous process. Structure An IPS integrates information from two sources:
Not all of these dimensions may be needed; in many cases company data is incomplete and not structured along all dimensions. A pooled-cross-sectional-time-series model that links geography, product and end-market served is an ideal approach to these multi-dimensional problems. Pooling of sparse data offers the ability to manage relationships more efficiently while providing useful statistical relationships. Shortening the number of periods – months, quarters, or years – forcing relationships to reflect current conditions while not sacrificing statistical relevance. [1] IPS’s may be limited to national data, regional data, or cover global economic data.
|
Skill ThreeScenario Development Module Handbook
Objective: Provide a user’s guide to revising scenarios and developing quantitative estimates of impact of changing social, environmental, economic, and political developments on global output and world trade (commodity specific).
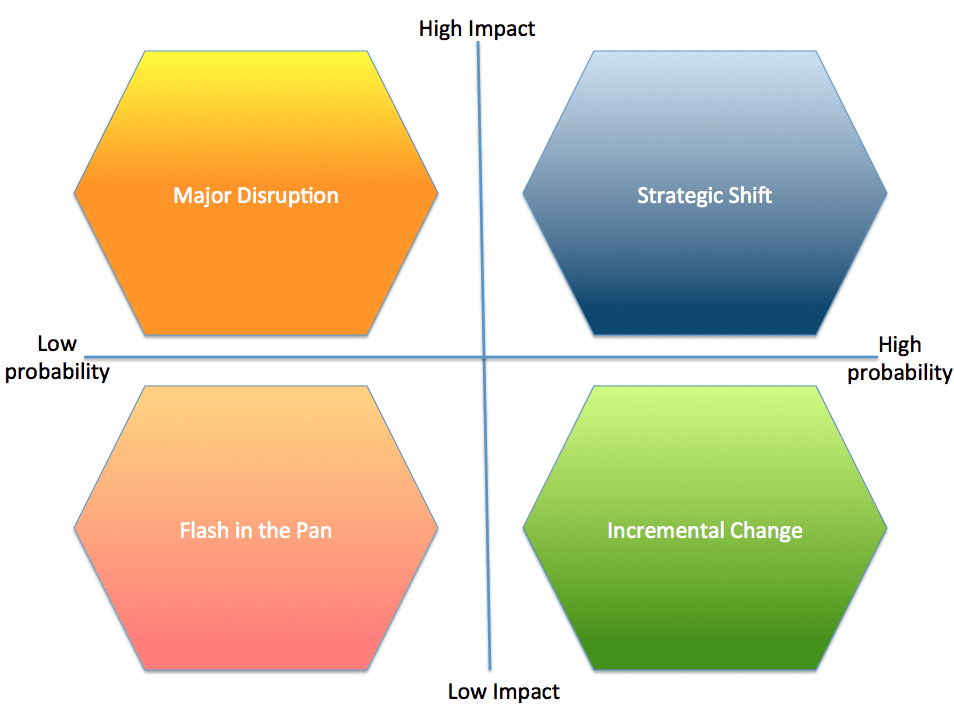
Developing Scenarios Scenarios are developed to bookmark possible outcomes of policy or other, non-economic factors. Of course every non-economic factor has an economic consequence. Once human evolution expanded from self-contained tribal or village structures where anything that was needed could be found within a small geographical area, to the global economy man became linked within a causal chain where weather events in one part of the world impact food prices and costs of living in another. Thus almost any event that may appear to be purely political or sociological may also be considered to have an “economic consequence” that needs to be understood and if possible quantified. The four quadrants are meant to allow for variations in key factors, but logically there are many possible variants of economic, social, political, and environmental factors that could be used in creating scenarios. Some of the scenarios developed by Shell Oil can stretch to pages of possible future outcomes as it will impact the demand and supply for energy.. Human beings tend to measure effects on a relative scale – 1 to 10, high to low, good to bad – so a graphical interpretation using the quadrants can allow the scenario developer to describe the likely environment for each quadrant.[1] Scenarios need not be limited to economics, but can describe the business environment faced by the company. Figures 2 and 3 offer glimpse of possible scenarios – one related purely to the economic environment within which companies operate and the second specifically geared to the companies business. In this example we relate it to a transportation company primarily because these companies have to operate within the broader global market, but it could as easily be an electronics manufacturer deciding between more innovations at a higher risk of failure or lower prices to ‘milk’ the existing cash cow until the market dries up completely.
| ||||||||||